
The Challenge
RNA-binding proteins (RBPs) are critical regulators of gene expression. An RBP typically binds to multiple mRNAs and modulates their expression via a binding site that can range from 4-8 nucleotides in length. In this experiment, we introduce specific RBPs to a variety of genes and measure the degredation of their expression over time. We then designed a custom large language model (LLM) that takes the gene sequences as input and outputs a rate of degredation as output. This project can help us better understand the interaction between RBP and gene expression.
The Plan
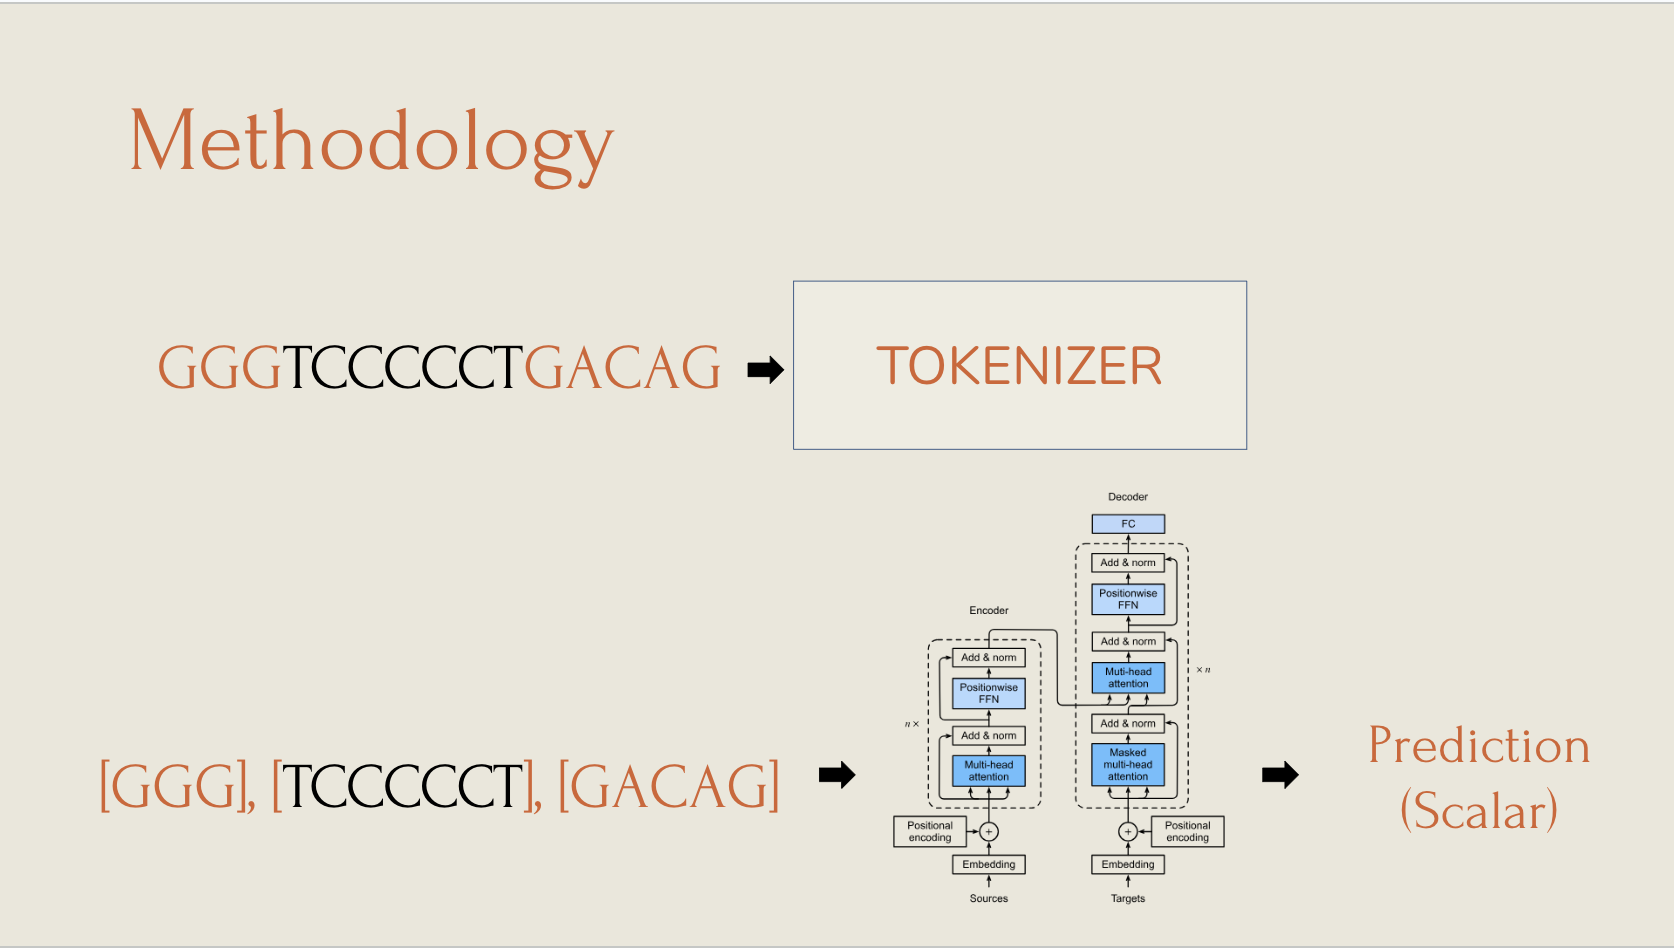
LLMs and their corresponding tokenizers are typically designed to handle human languages such as English. In order to utilize LLMs for gene sequences, we had to utilize DNABERT along with our own specially trained tokenizer that took advantage of Morfessor, a tool for semi-supervised morphological segmentation (read more here). We then fed these tokenizers though a sequence to regression LLM in order to predict the rate of gene expression degradation.
The Data
The project utilizes sequence data with motif compositions and expression rates:
| ID | 1h | 2h | 3h | 4h | 5h | 6h | 7h | 8h | 10h |
|---|---|---|---|---|---|---|---|---|---|
| S0_M_T1 | 1.1502 | 1.1256 | 1.4005 | 0.2332 | 0.73195 | -0.47038 | -0.57411 | -0.25983 | -0.76564 |
Each ID correponds to an RNA sequence:
| ID | Sequence |
|---|---|
| S0_M_T1 | TGTCCCC… |
In order to capture the rate of degradation, we take the change in gene between t = 8h and t = 2h.
The Model
We utilized a customized DNABERT2 model to take RNA sequences as input. The output layer is a single scalar value, which represents the predicted regression rate. We tested 3 different models: Model_O, Model_D, and Model_DNA, based off of differing experimental methods. The models differed in tokenization in order to determine which strategy was best. The a typical workflow for our model is demonstrated below:
The Results
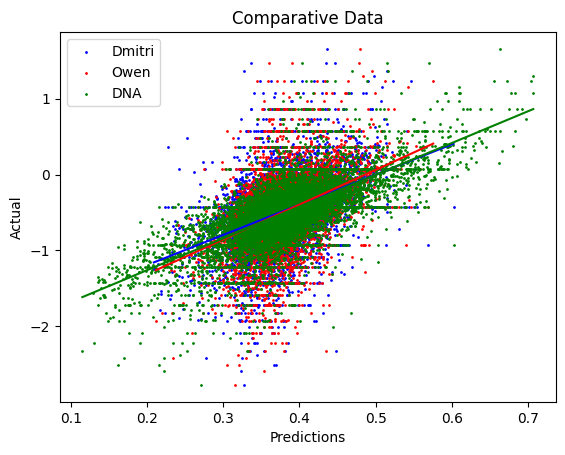
Model_DNA achieved the highest accuracy with an R² = 0.457. Comparative data is shown below.
Comparison with Canonical Models
| Model | MSE | MAE | RMSE | R² |
| DNABERT2 | 0.092 | 0.216 | 0.304 | 0.457 |
| MORPH_D | 0.144 | 0.265 | 0.379 | 0.174 |
| MORPH_O | 0.141 | 0.261 | 0.375 | 0.178 |
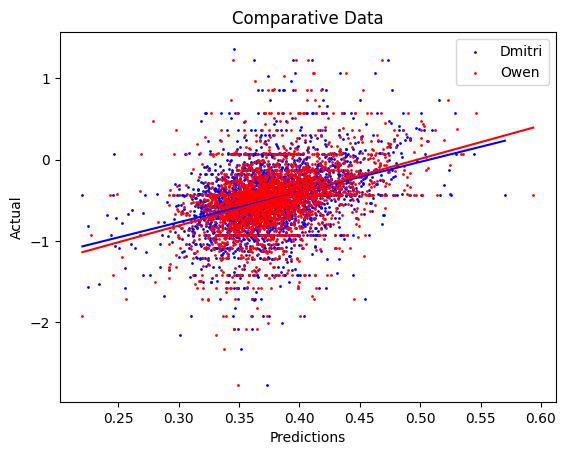
Here, we plot the predictions against the real expression degradation. As seen in figure one, Model_O (Owen) and Model_D (Dmitry) are able to capture some patterns, while Model_DNA far exceeds both in terms of accuracy.
The Conclusion
These results confirm our models’ ability predict gene expression rates from RNA sequences. Our team was very happy with these results, especially when it came to utilizing a custom-built tokenizer to encode sequences into motifs. These techiques will help us better understand and analyze gene expression rates.
Github
Full Code and explanation can be found at our GitHub.